An enterprise grade SAS drive is spec’d at 3ms to 8ms response times.
Guys at Microsoft will tell you they want 10ms or less for everything. My goal is 10ms for the transaction log (LDF), and 20ms for the data files (MDF/NDF).
What happens when your are beyond 10ms on the t-log?
- The log buffer fills up,
- SQL Server sees the disk is being thrashed and takes it’s foot off the pedal because it can’t buffer anymore IO requests to the log,
- At this point, locks start getting held much longer,
- Severe blocking and deadlocks start to occur,
- Applications start to time out and go into retries, etc…
- The system stops being usable.
Errors like this start showing up in the ERRORLOG:
SQL Server has encountered x occurrence(s) of I/O requests taking longer than 15 seconds to complete on file [Drive:\MSSQL\MSSQL.1\MSSQL\Data\xyz.mdf] in database [database]. The OS file handle is 0x00000000. The offset of the latest long I/O is: 0x00000000000000
For more information on this:
The curious thing, CPU goes way down because no work is being done. This makes most sysadmins scratch their heads because they don’t realize where the bottleneck is.
Two ways of getting numbers:
PerfMon: Real Time
- Avg. Disk Sec/Read
- Avg. Disk Sec/Write
- Avg. Disk Sec/Transfer
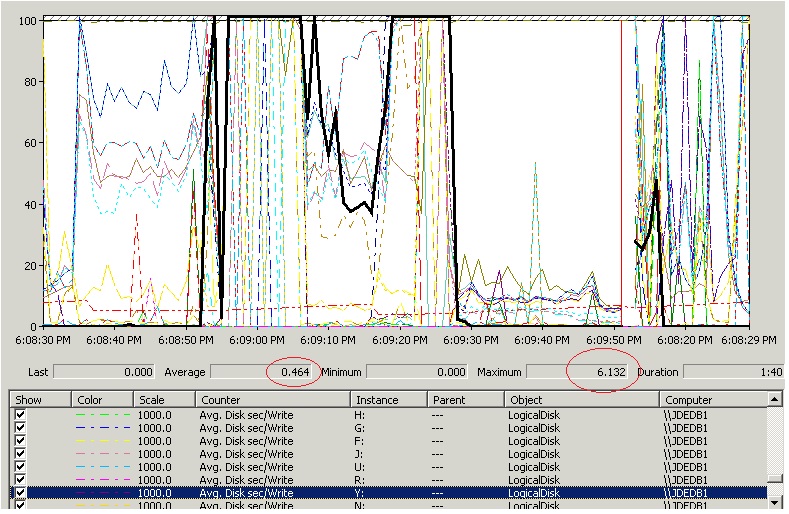
Reading the PerfMon Output: .010 = 10ms, .050 = 50ms, 1.000 = 1 second, etc…
Here’s and example of 6,132ms (6 seconds) response times on a write operation (really bad).
DMV to see Virtual File Stats: Averages since system was started
SELECT
–virtual file latency
vReadLatency
= CASE WHEN num_of_reads = 0
THEN 0 ELSE (io_stall_read_ms/num_of_reads) END
, vWriteLatency
= CASE WHEN num_of_writes = 0
THEN 0 ELSE (io_stall_write_ms/num_of_writes) END
, vLatency
= CASE WHEN (num_of_reads = 0 AND num_of_writes = 0)
THEN 0 ELSE (io_stall/(num_of_reads + num_of_writes)) END
–avg bytes per IOP
, BytesperRead
= CASE WHEN num_of_reads = 0
THEN 0 ELSE (num_of_bytes_read/num_of_reads) END
, BytesperWrite
= CASE WHEN num_of_writes = 0
THEN 0 ELSE (num_of_bytes_written/num_of_writes) END
, BytesperTransfer
= CASE WHEN (num_of_reads = 0 AND num_of_writes = 0)
THEN 0 ELSE ((num_of_bytes_read+num_of_bytes_written)/(num_of_reads + num_of_writes)) END

, LEFT(mf.physical_name,2) as Drive
, DB_NAME(vfs.database_id) as DB
–, mf.name AS FileName
, vfs.*
, mf.physical_name
FROM sys.dm_io_virtual_file_stats(NULL,NULL) as vfs
JOIN sys.master_files as mf ON vfs.database_id = mf.database_id AND vfs.file_id = mf.file_id
–WHERE mf.type_desc = ‘LOG’ — log files
–WHERE DB_NAME(vfs.database_id) IN (‘tpcc’,’tpcc2′)
ORDER BY vLatency DESC
— ORDER BY vReadLatency DESC
— ORDER BY vWriteLatency DESC
The following is a sample output showing that the Read Latency is 6ms and the Write Latency is 255ms with the Average Latency (R+W) is 145ms.
vReadLatency         vWriteLatency        vLatency             Drive DB         physical_name
-------------------- -------------------- -------------------- ----- ---------- -----------------------------------------------------
6                    255                  145                  F:    tempdb     F:\MSSQL10_50.MSSQLSERVER\MSSQL\Data\tempdb12.ndf
6                    255                  145                  F:    tempdb     F:\MSSQL10_50.MSSQLSERVER\MSSQL\Data\tempdb11.ndf
6                    255                  145                  F:    tempdb     F:\MSSQL10_50.MSSQLSERVER\MSSQL\Data\tempdb10.ndf
6                    254                  145                  F:    tempdb     F:\MSSQL10_50.MSSQLSERVER\MSSQL\Data\tempdb5.ndf
6                    255                  145                  F:    tempdb     F:\MSSQL10_50.MSSQLSERVER\MSSQL\Data\tempdb4.ndf
6                    255                  145                  F:    tempdb     F:\MSSQL10_50.MSSQLSERVER\MSSQL\Data\tempdb3.ndf
6                    255                  145                  F:    tempdb     F:\MSSQL10_50.MSSQLSERVER\MSSQL\DATA\tempdb2.ndf
6                    255                  145                  F:    tempdb     F:\MSSQL10_50.MSSQLSERVER\MSSQL\DATA\tempdb.mdf
6                    255                  145                  F:    tempdb     F:\MSSQL10_50.MSSQLSERVER\MSSQL\Data\tempdb13.ndf
6                    255                  145                  F:    tempdb     F:\MSSQL10_50.MSSQLSERVER\MSSQL\Data\tempdb14.ndf

(10 row(s) affected)
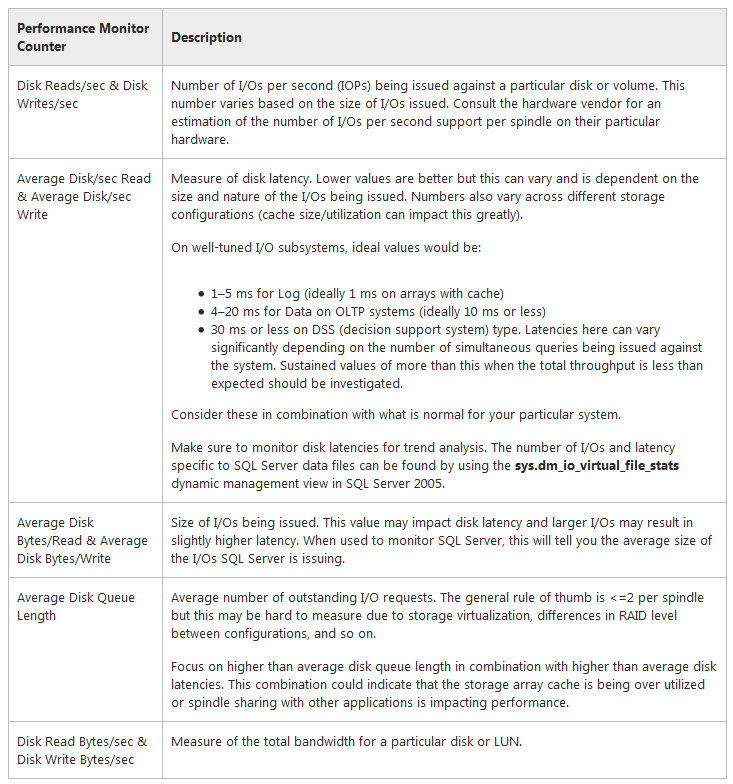
The following chart from Microsoft (http://technet.microsoft.com/en-us/library/cc966412.aspx) shows what they expect: